I recently had the opportunity to experience the power and potential of open data sources, and thought it was worth sharing.
About five years ago I first read about OpenDataPhilly, a portal built by Philadelphia company Azavea to encourage the sharing and creative use of publicly-available information sources. The site hosts over 300 datasets as well as applications and APIs related to the Philadelphia region. When I started playing with the Leaflet Javascript library, which can be used to build web pages with dynamic geo-mapping, I immediately thought about applying it to one of the OpenDataPhilly data sources: the Philadelphia Crime Incident database. It includes details of every reported crime incident in Philadelphia since 2006, including geo-coordinates that can be overlaid on a map.
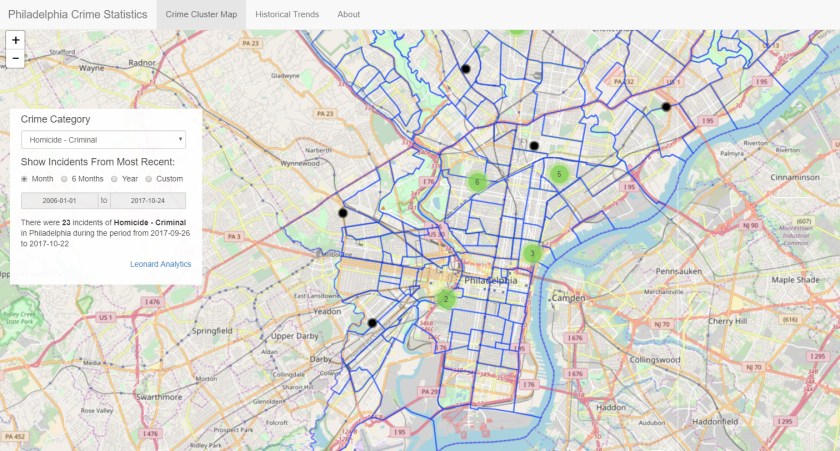
So I put together this application that lets you explore crime incidents and historical trends for 33 different crime categories. The Crime Cluster Map uses the Leaflet library to show the location of crime incidents during a specified time period; you can zoom in or pan out and it automatically clusters incidents to give you a sense of where the most crimes took place. On the backend, the app is using a web-based API to query the database. If you click on a black circle representing a single crime incident, you will get a pop-up with a few details, including a link to a Google search for more information about the incident (it’s hit-or-miss; you’re more likely to find a relevant news story for a major crime). I also took advantage of another data source provided by Azavea which enabled me to include an overlay of Philadelphia neighborhood boundaries.
The Historical Trends tab shows the number of incidents each year by category; the good news is that crime has been trending down in just about every category since 2006. One thing to note: the fetching of data via the API can be a bit slow at times, especially for the historical trends tab.
I have all kinds of ideas for enhancing this app, but I may just stop here; it turns out there are a number of sites that are taking advantage of this same data to deliver high-quality information, most notably the Philadelphia Inquirer. Nonetheless, my little journey has been instructive and eye-opening.
Do you have any thoughts about how to take advantage of public data sources to develop compelling applications? Feel free to share.
— dml
