Update 2017-10-16
At the request of 4R, I have removed the shiny application referenced in this blog post. I will be posting another application shortly that illustrates the power of the shiny platform in other respects – stay tuned!
A picture is worth a thousand words
I was recently talking to a client about the challenges of allocating the right amount of goods to a store from a distribution center when you have a limited number of weeks left before the end of the season. We talked about the factors involved: item demand, length of the next coverage period, time remaining in the season, variability of demand for the item, item margin, etc. As I tried to explain how all of these factors interact to affect the optimal allocation, I recalled that when I worked at 4R Systems, the analytics team created a simple “optimizer” in Excel to illustrate what happens when these various parameters change. I decided to create my own version as a shiny application that I could easily share with my client; you can go here to try it out…let me know what you think. What follows are a few quick notes about the tool and how I built it.
About the Seasonal Inventory Optimizer
A fundamental element of determining how many units you should have in a store right now is to recognize that, even though you know what sells on average, there is a certain probability that you will sell more or less than that in any given period of time. In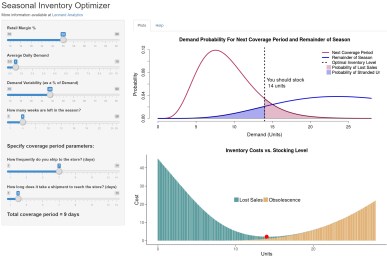 order to model that, we use a little probability theory to estimate the likelihood of selling a given number of units during the next coverage period, and over the remainder of the season. Then we can estimate the expected lost sales that will occur over the next coverage period at a given stocking level, as well as the expected obsolescence cost at the end of the season due to unsold units. If you add together those values (lost sales + obsolescence cost) for each level of allocation, then the optimal stocking level is the one with the lowest total cost. I made a few simplifying assumptions for the purposes of this demonstration tool: demand rate is constant over the remainder of the season, and if a unit is not sold by the end of the season, you lose its entire value (i.e., obsolescence cost = 100% of the unit’s cost).
This tool is great for understanding the dynamics of the process, but if you want to put this idea into practice for your business, you’ll need an industrial-strength version that integrates with your allocation system and takes into account more factors. Surprisingly, not too many commercially-available solutions exist that truly optimize the allocation process, but take a look at 4R’s solution, which profit-optimizes your allocations while taking into account all of the necessary factors.
About Shiny Apps
I do a lot of programming in R, which is an open-source language that is popular among data scientists. An organization called RStudio has been a major proponent of the R language and ecosystem; they created the RStudio IDE, and in 2015 launched a web service that hosts applications written in R using a package called “shiny”. As it says in the help page for shiny, it “Makes it incredibly easy to build interactive web applications with R. Automatic “reactive” binding between inputs and outputs and extensive prebuilt widgets make it possible to build beautiful, responsive, and powerful applications with minimal effort.” And it certainly does – I was able to put this application together in record time without having to fidget with html or style sheets. Shiny is a great way to prototype any visual application. If you want to learn more, just leave me a comment.
dml
